

Flat Circle - Are we merely flipping coins?
Plus: adding new Gemini model, upgrading context template, risk analysis for Grok and Sonnet, and 16 upcoming earnings calls

Flat Circle measures the ability of language models to predict company earnings results. See our methodology for detail and disclaimers. If you haven’t already subscribed, join investors and engineers interested in LLMs+investment research here:
Key takeaways
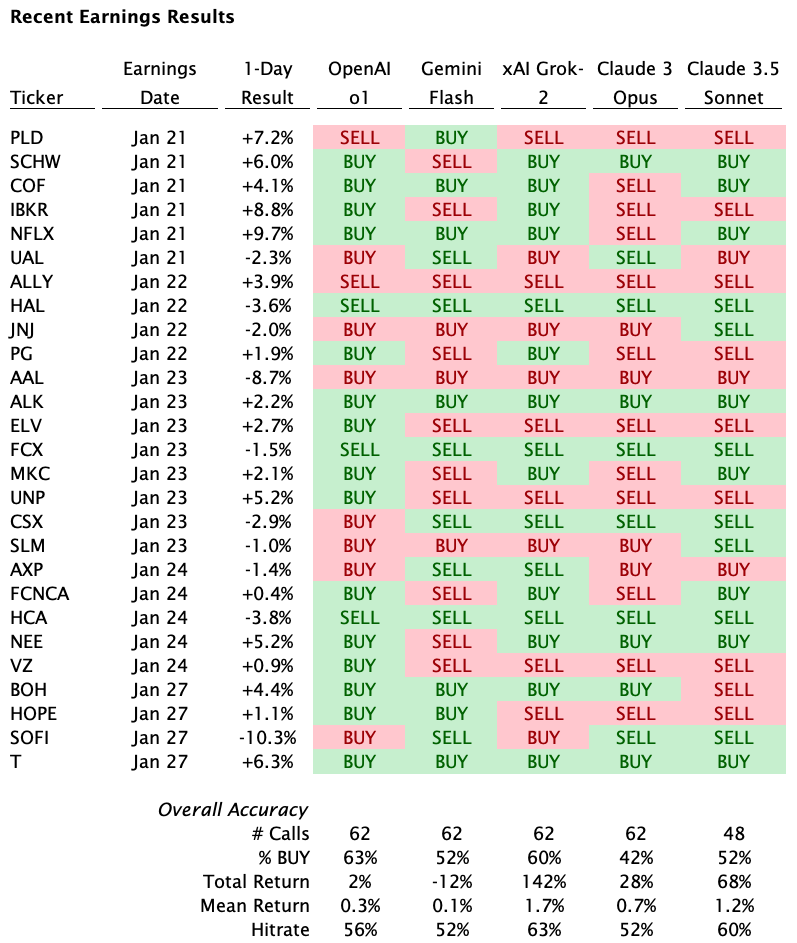
After 62 live earnings, Grok-2 remains in the lead with a 63% hitrate and a mean return of +171 bps
Claude Sonnet is in second place with a 60% hitrate and +119 bps per earnings
In addition to having a high hitrate, Grok and Sonnet do the best job at limiting losses when they are wrong
Are the models merely flipping coins?
To put Grok’s 63% hitrate in context, we ran a thousand simulations of 5 models flipping coins 62 times
63% is between 1 and 2 standard deviations from the mean. In other words, if the 5 models were guessing randomly, the best performing model would show a hitrate of at least 63% ~10% of the time
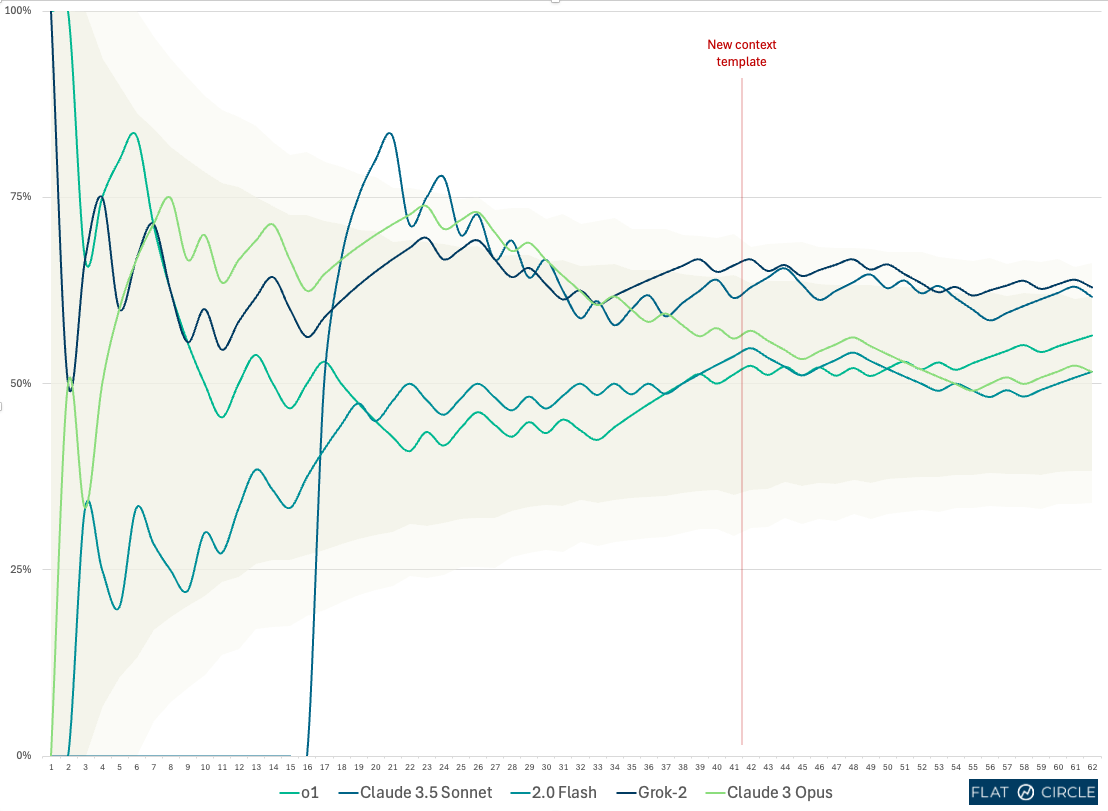
Our new context template, which determines the company information we feed each model, successfully improved results across all models
We show a comparative analysis below and are now using it as our primary context template
The new context includes market commentary, institutional holders and fewer past quarters
Gemini released its new Flash Thinking model, “capable of stronger reasoning capabilities”.
We have added this as an additional model and include its calls in the upcoming earnings section below
We plan to add DeepSeek, but the model has a much lower context limit so we need to rearchitect some things to create a fair comparison
Recent earnings
Are we merely flipping coins?
The hitrate of the best performing model (Grok-2) is 63% after 62 live earnings calls. Because we’re selecting the best result of 5 separate models, random guessing alone would often return results above 50%. We checked by simulation and found that the best performing coin‐flipper scores 63% or higher in ~10% of scenarios. In other words, Grok’s results are between 1 and 2 standard deviations above the mean if all five models were randomly guessing.
Improved context
Our first attempt at giving each model more information when asking it to make a BUY or SELL call) resulted in decreased performance. Based on these learnings, we developed another attempt at an improved Context for the models including:
adding market commentary for all historical quarters
including fewer historical quarters
adding institutional holders
The new context template has demonstrated improved performance.

A few examples of enhanced reasoning:
Case Study: AT&T (T)
AT&T rose 7% monday, driven by beat on mobile-phone and fiber customers. Most models already pointed to BUY with both contexts, but the new context switched Claude Opus from SELL to BUY, driven the following:
“At the recent Analyst Day in December 2024, management provided an encouraging long-term outlook, including plans to expand its fiber network to over 50 million locations. They guided for sustained growth in key metrics like service revenue, EBITDA, free cash flow and EPS.”
The company’s analyst day was not previously fed into the models’ context and appears to be an incremental factor in Claude Opus’ decision to BUY. We are working on more robust ways to add analyst day and conference presentations.
Case Study: HCA Healthcare (HCA)
HCA missed earnings Friday, declining 4%. While operating metrics improved, the loss was primarily due to greater than expected hurricane impacts.
Both o1 and Sonnet's models recommended BUY with the original context template and SELL with the new template.
Old Context format
o1 - BUY
"The share price has underperformed due to short-term hurricane impacts, but HCA reaffirmed guidance and expects strong demand and stable margins into next year, positioning the stock for upside.""
Sonnet - BUY
"While the share price has declined 17% since Q3 earnings due to hurricane impacts, the market appears to be overly focused on temporary disruptions rather than the strong underlying business performance and recovery trajectory. With operational metrics improving and hurricane impacts starting to anniversary, Q4 results are likely to demonstrate better-than-expected recovery and strong core performance, driving shares higher."
New Context format
o1 - SELL
"With Q4 expected at the lower end of guidance amid continued hurricane-related headwinds, analysts lowering targets, and growing policy uncertainties (ACA subsidies), near-term risks appear elevated, making a weaker post-earnings share reaction more likely than upside."
Sonnet - SELL
"The combination of known hurricane headwinds, analyst concerns about policy/subsidy risks, and decelerating growth metrics suggests Q4 results and/or 2025 guidance could disappoint current expectations, likely leading to further share price weakness."
Case Study: Union Pacific (UNP)
Old Context format - o1 - SELL
“Despite Union Pacific’s solid operations and year-over-year results, recent quarters’ earnings releases have disappointed investors and triggered stock price declines. Management has guided fourth-quarter results to be roughly in line with the third quarter, which appears below market expectations for stronger growth. As a result, the stock is at risk of another post-earnings pullback.”
New Context format - o1 - BUY
“Union Pacific has consistently improved its service reliability and operating efficiency, which is enabling volume gains (particularly in Intermodal) and driving solid pricing despite a soft freight environment. Management’s focus on cost control and a ‘buffer’ approach to resources has delivered steady margin expansion and double-digit EPS growth even with negative mix from elevated international Intermodal volumes and ongoing coal weakness.”
The new context written pre-earnings was very similar to a post-earnings summary written by the sellside (BMO Capital Markets)…
“UNP delivered industry leading improvement in opex (ex. fuel) …Efficiency gains can be seen across the network including better labor productivity, train length, and locomotive productivity. Service enhancement should prove accretive to volume in the coming years, and we expect cyclical tailwinds to drive strong EPS growth. F2025 EPS outlook for HSD to LDD growth despite a modest volume picture underscores the operating leverage opportunity of a more efficient network. Management sees further runway to optimize performance. Management is guiding to a mixed volume growth outlook amid coal headwinds, challenging international intermodal comps, and a varied economic backdrop.”
Picking up pennies in front of a steamroller?
Some readers expressed concern that LLMs may tend to make the ‘consensus’ call, causing them to have a higher than average hitrate but experience huge losses when they are wrong.
The current prompt template doesn’t instruct the models to factor in asymmetric upside or downside in their calls. Still, the models appear to differ in how they “risk-adjust:”

Note: we added Claude Sonnet on January 13, so it missed the painful Walgreens earnings and thrilling Radius Recycling earnings impacting the other models.
We will watch how the gains and losses compare as the earnings roll through and experiment with incorporating risk more explicitly in our prompt.
Upcoming earnings

The reasoning behind these calls are available here.
Follow the progress of LLM investment research
If you have feedback or would like to participate in this project, please reply to this email or reach out via X or LinkedIn.